Getting Started With Conjoint Analysis 豆瓣
作者:
Orme, Bryan K.
Research Pub Llc
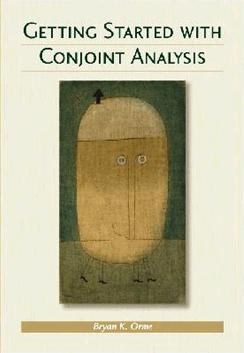
This 164-page book assembles and updates introductory white papers that have been available on our website. There are substantial new sections, including a 50-page glossary of terms, and two new chapters.
Paul Green (Professor Emeritus of Marketing, University of Pennsylvania) and the "father of conjoint analysis" wrote the foreword for Getting Started with Conjoint Analysis. He writes: "Getting Started with Conjoint Analysis is a practical no-nonsense guide to what happens when one designs, executes, and analyzes data from real marketplace problems. It should appeal to academics and consultant-practitioners alike. The book is easy to follow, while at the same time being almost encyclopedic in its coverage of topics ranging from study design to the presentation of results to clients."
Paul Green (Professor Emeritus of Marketing, University of Pennsylvania) and the "father of conjoint analysis" wrote the foreword for Getting Started with Conjoint Analysis. He writes: "Getting Started with Conjoint Analysis is a practical no-nonsense guide to what happens when one designs, executes, and analyzes data from real marketplace problems. It should appeal to academics and consultant-practitioners alike. The book is easy to follow, while at the same time being almost encyclopedic in its coverage of topics ranging from study design to the presentation of results to clients."


