Visual Explanations 豆瓣 Goodreads
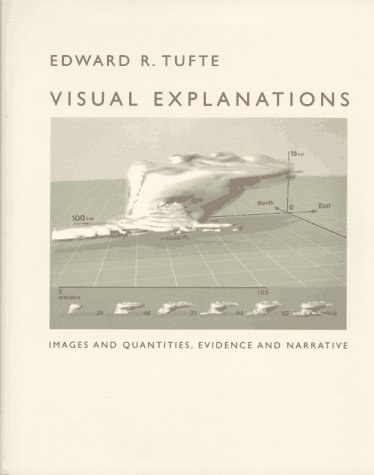
Visual Explanations: Images and Quantities, Evidence and Narrative
作者:
Edward R. Tufte
Graphics Press
1997
- 2
Visual Explanations: Images and Quantities, Evidence and Narrative is about pictures of verbs, the representation of mechanism and motion, process and dynamics, causes and effects, explanation and narrative. Practical applications and examples include statistical graphics, charts for making important decisions in engineering and medicine, technical manuals, diagrams, design of computer interfaces and websites and on-line manuals, animations and scientific visualizations, techniques for talks, and design strategies for enhancing the rate of information transfer in print, presentations, and computer screens. The use of visual evidence in deciding to launch the space shuttle Challenger is discussed in careful detail. Video snapshots show redesigns of a supercomputer animation of a thunderstorm. The book is designed and printed to the highest standards, with luscious color throughout and four built-in flaps for showing motion and before/after effects.