设计

Dzming Li

Dzming Li @dzming_li

7 本书  

zsbd

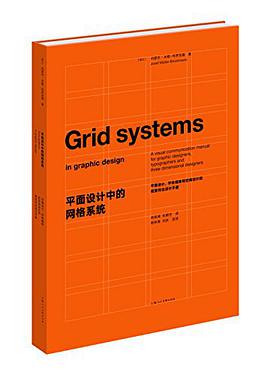
平面设计中的网格系统 [图书] 豆瓣
Grid systems in graphic design
8.6 (27 个评分) 作者: 约瑟夫·米勒-布罗克曼 译者: 徐宸熹 / 张鹏宇 上海人民美术出版社 2016 - 6
本书主要介绍了网格的功能和使用方法,旨在为平面和空间的设计师们提供一个实际的工具,让他们可以从概念、组织结构和设计上更有效、自信地处理和解决视觉问题。
与此同时,此书也为设计教育者提供了帮助,让他们能在教学中更好地解决实际问题。一方面,教师通过教学能为学生 提供一个很好的机会去了解和熟悉网格设计的要点和方法;另一方面,学生也可以通过自我训练的方式去学习如何使用它。
为了读者能够更容易了解和掌握网格设计的原理,我将在书里尽可能详细地解释网格系统,并逐步分析网格设计中的关键步骤。
事实上,绝大多数的设计师都不知道、也不理解为什么要建立这样的一个秩序系统。所以,如果想要合理、功能地运用网格系统,那就必须仔细地研究网格的所有原理。只要不嫌麻烦,任何研究网格的人都会发现,在网格系统的帮助下,他都能更快地解决设计中的问题,并让设计更具功能性、逻辑性和视觉美感。
好用型设计 [图书] 豆瓣
the Design of Everyday Things
作者: [美国] 唐纳德·A·诺曼 译者: 梅琼 中信 2007 - 10
所有伟大的设计,都是在艺术美、可靠性、安全性、易用性、成本和性能之间寻找平衡与和谐。《好用型设计》是设计学领域权威力作,业内人士必读经典!
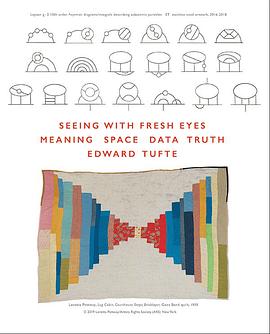
Beautiful Evidence [图书] 豆瓣 Goodreads
Beautiful Evidence
作者: Edward R Tufte Graphics Pr 2006 - 1
Science and art have in common intense seeing, the wide-eyed observing that generates visual information.
is about how seeing turns into showing, how data and evidence turn into explanation. The book identifies excellent and effective methods for showing nearly every kind of information, suggests many new designs (including sparklines), and provides analytical tools for assessing the credibility of evidence presentations (which are seen from both sides: how to produce and how to consume presentations). For alert consumers of presentations, there are chapters on diagnosing evidence corruption and PowerPoint pitches.
concludes with two chapters that leave the world of pixel and paper flatland representations - and move onto seeing and thinking in space land, the real-land of three-space and time.
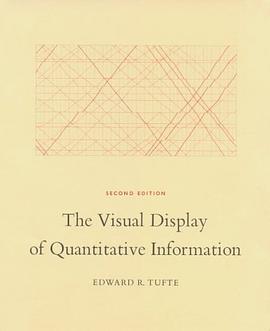
The Visual Display of Quantitative Information [图书] 豆瓣 Goodreads
The Visual Display of Quantitative Information
8.8 (5 个评分) 作者: Edward R. Tufte Graphics Pr 2001 - 1
The classic book on statistical graphics, charts, tables. Theory and practice in the design of data graphics, 250 illustrations of the best (and a few of the worst) statistical graphics, with detailed analysis of how to display data for precise, effective, quick analysis. Design of the high-resolution displays, small multiples. Editing and improving graphics. The data-ink ratio. Time-series, relational graphics, data maps, multivariate designs. Detection of graphical deception: design variation vs. data variation. Sources of deception. Aesthetics and data graphical displays.
This is the second edition of The Visual Display of Quantitative Information. Recently published, this new edition provides excellent color reproductions of the many graphics of William Playfair, adds color to other images, and includes all the changes and corrections accumulated during 17 printings of the first edition.
This book celebrates escapes from the flatlands of both paper and computer screen, showing superb displays of high-dimensional complex data. The most design-oriented of Edward Tufte's books, Envisioning Information shows maps, charts, scientific presentations, diagrams, computer interfaces, statistical graphics and tables, stereo photographs, guidebooks, courtroom exhibits, timetables, use of color, a pop-up, and many other wonderful displays of information. The book provides practical advice about how to explain complex material by visual means, with extraordinary examples to illustrate the fundamental principles of information displays. Topics include escaping flatland, color and information, micro/macro designs, layering and separation, small multiples, and narratives. Winner of 17 awards for design and content. 400 illustrations with exquisite 6- to 12-color printing throughout. Highest quality design and production.
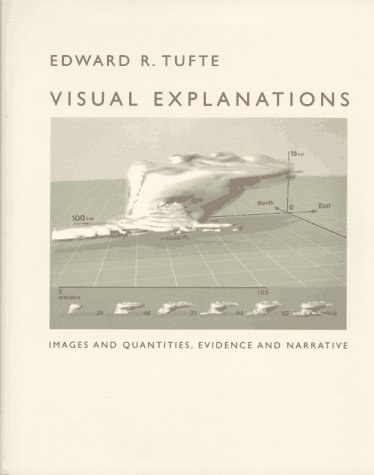
Visual Explanations: Images and Quantities, Evidence and Narrative is about pictures of verbs, the representation of mechanism and motion, process and dynamics, causes and effects, explanation and narrative. Practical applications and examples include statistical graphics, charts for making important decisions in engineering and medicine, technical manuals, diagrams, design of computer interfaces and websites and on-line manuals, animations and scientific visualizations, techniques for talks, and design strategies for enhancing the rate of information transfer in print, presentations, and computer screens. The use of visual evidence in deciding to launch the space shuttle Challenger is discussed in careful detail. Video snapshots show redesigns of a supercomputer animation of a thunderstorm. The book is designed and printed to the highest standards, with luscious color throughout and four built-in flaps for showing motion and before/after effects.
Visual Explanations [图书] 豆瓣 Goodreads
Visual Explanations: Images and Quantities, Evidence and Narrative
作者: Edward R. Tufte Graphics Press 1997 - 2
Visual Explanations: Images and Quantities, Evidence and Narrative is about pictures of verbs, the representation of mechanism and motion, process and dynamics, causes and effects, explanation and narrative. Practical applications and examples include statistical graphics, charts for making important decisions in engineering and medicine, technical manuals, diagrams, design of computer interfaces and websites and on-line manuals, animations and scientific visualizations, techniques for talks, and design strategies for enhancing the rate of information transfer in print, presentations, and computer screens. The use of visual evidence in deciding to launch the space shuttle Challenger is discussed in careful detail. Video snapshots show redesigns of a supercomputer animation of a thunderstorm. The book is designed and printed to the highest standards, with luscious color throughout and four built-in flaps for showing motion and before/after effects.
Understanding Comics [图书] 豆瓣 谷歌图书
9.5 (16 个评分) 作者: Scott McCloud 译者: 云中漫步 / Monos William Morrow Paperbacks 1994 - 4
内容简介:系统的介绍了漫画的发展沿革、艺术语言、表现手法,是一本向大众普及漫画艺术的入门作品——它用简单的画面告诉人们,漫画不是宅男的读物,而是一种拥有强烈表现力的艺术形式。
创建日期: 2024年5月5日