Beautiful Visualization 豆瓣
作者:
Julie Steele
/
Noah Iliinsky
O'Reilly Media
2010
- 6
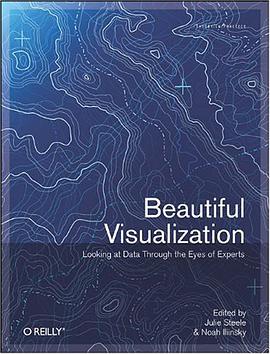
Visualization is the graphic presentation of data -- portrayals meant to reveal complex information at a glance. Think of the familiar map of the New York City subway system, or a diagram of the human brain. Successful visualizations are beautiful not only for their aesthetic design, but also for elegant layers of detail that efficiently generate insight and new understanding.
This book examines the methods of two dozen visualization experts who approach their projects from a variety of perspectives -- as artists, designers, commentators, scientists, analysts, statisticians, and more. Together they demonstrate how visualization can help us make sense of the world.
Explore the importance of storytelling with a simple visualization exercise
Learn how color conveys information that our brains recognize before we're fully aware of it
Discover how the books we buy and the people we associate with reveal clues to our deeper selves
Recognize a method to the madness of air travel with a visualization of civilian air traffic
Find out how researchers investigate unknown phenomena, from initial sketches to published papers
Contributors include:
Nick Bilton, Michael E. Driscoll, Jonathan Feinberg, Danyel Fisher, Jessica Hagy, Gregor Hochmuth, Todd Holloway, Noah Iliinsky, Eddie Jabbour, Valdean Klump, Aaron Koblin, Robert Kosara, Valdis Krebs, JoAnn Kuchera-Morin et al., Andrew Odewahn, Adam Perer, Anders Persson, Maximilian Schich, Matthias Shapiro, Julie Steele, Moritz Stefaner, Jer Thorp, Fernanda Viegas, Martin Wattenberg, and Michael Young.

