The classic book on statistical graphics, charts, tables. Theory and practice in the design of data graphics, 250 illustrations of the best (and a few of the worst) statistical graphics, with detailed analysis of how to display data for precise, effective, quick analysis. Design of the high-resolution displays, small multiples. Editing and improving graphics. The data-ink ratio. Time-series, relational graphics, data maps, multivariate designs. Detection of graphical deception: design variation vs. data variation. Sources of deception. Aesthetics and data graphical displays.
This is the second edition of The Visual Display of Quantitative Information. Recently published, this new edition provides excellent color reproductions of the many graphics of William Playfair, adds color to other images, and includes all the changes and corrections accumulated during 17 printings of the first edition.
This book celebrates escapes from the flatlands of both paper and computer screen, showing superb displays of high-dimensional complex data. The most design-oriented of Edward Tufte's books, Envisioning Information shows maps, charts, scientific presentations, diagrams, computer interfaces, statistical graphics and tables, stereo photographs, guidebooks, courtroom exhibits, timetables, use of color, a pop-up, and many other wonderful displays of information. The book provides practical advice about how to explain complex material by visual means, with extraordinary examples to illustrate the fundamental principles of information displays. Topics include escaping flatland, color and information, micro/macro designs, layering and separation, small multiples, and narratives. Winner of 17 awards for design and content. 400 illustrations with exquisite 6- to 12-color printing throughout. Highest quality design and production.
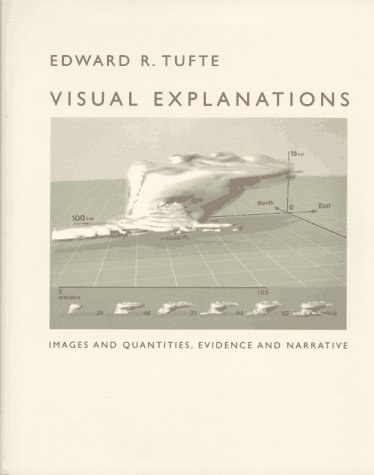
Visual Explanations: Images and Quantities, Evidence and Narrative is about pictures of verbs, the representation of mechanism and motion, process and dynamics, causes and effects, explanation and narrative. Practical applications and examples include statistical graphics, charts for making important decisions in engineering and medicine, technical manuals, diagrams, design of computer interfaces and websites and on-line manuals, animations and scientific visualizations, techniques for talks, and design strategies for enhancing the rate of information transfer in print, presentations, and computer screens. The use of visual evidence in deciding to launch the space shuttle Challenger is discussed in careful detail. Video snapshots show redesigns of a supercomputer animation of a thunderstorm. The book is designed and printed to the highest standards, with luscious color throughout and four built-in flaps for showing motion and before/after effects.